
The Magic Kingdom | An Economic History

Disclaimer:
None of the information discussed in this thesis is proprietary. All the data used was collected externally through published sources is in alignment with all WDC policies and procedures. The views expressed are not representative of the Walt Disney Company.
OBJECTIVE
In order to ensure future success and longevity, all endeavors must be quantifiable for the purpose of maintaining quality. Furthermore, such measurements help to maintain or improve overall efficiency and effectiveness in meeting the core goals and objectives. The following statistical study and the conclusions derived from the resulting data are intended for the sole purpose of illumination. It should be considered a critique and not a condemnation of current or past administrations as the self-destructive trends of the proceeding information surely would not have been executed purposefully if they were to be precognizant as to the ramifications of their actions.
IT’S ABOUT TIME
For the past 28 years, I've been intensively studying the history and legacy of Walt Disney — his company, his collaborators & most importantly the philosophies that made a creative empire. In 2013, while walking around the second oldest and most attended theme park on the planet, The Magic Kingdom I started thinking about many attractions that had come and gone during its (then) over 40-year history. Furthermore, I noticed how much the atmosphere and changed in that time. The guests appeared far more stressed than in recent decades. Spaces that were once vibrant and well-utilized were shuttered for years.
Still, never one to content with unfounded opinions, I wondered if my perceptions were nothing more than the rose-colored filter of time. Was it nostalgia or were there numbers — objective data to convert my feelings into cold-hard facts?
Although containing multiple service-related elements, a theme park is a product. Within this product is a finite supply of its signature component – that which separates itself from all other environments, based on a per-unit price, an inelastic supply of time to experience them…
Restaurants & shops are ubiquitous non-exclusive institutions, and parades & fireworks are unchanging in consistency of presentation. The pivotal element of any theme park and that which serves as both the backbone and engine of its operation is its supply of attractions – not in frequency but in cumulative duration. For, the number of attractions cannot quantitatively indicate the true supply that must be measured as a function of time consumed with entertainment and not the wait between experiences.
Attractions Timeline
By now, you've seen The Magic Kingdom Attraction Timeline — A chronology of every attraction that has ever existed in its 50-year history.

Click on image to inspect in high-resolution
But this is by far not the whole story, nor is it representative of the Value (Supply) of entertainment. "Dumbo The Flying Elephant" occupies the same space with "The Haunted Mansion". "Tropical Serenade" is on par with its "...Under New Management" replacement. And while we may have our own subjective preferences for one show over the other, what is the objective measurement between the two?
Although by no means perfect or definitive the time (or duration) spent experiencing these attractions is the only objective measurement by which we can discern the overall value of the park — not only in terms of financial & temporal ROI (Return On Investment) but also in terms of optimal operational performance.
Taking this into account, our one-dimensional timeline can be more precisely represented with the Y-axis depicting the net worth of an attraction to the park.

Click on image to inspect in high-resolution
While this proportional timeline is closer to an accurate depiction of the park's supply of entertainment, it does require further refinement to discern the accumulative value and logistical capability of the park to efficiently distribute its guests. For that, we will need to make things a little more complex by removing the space between attractions to come-up with a summation of value over time.

Click on image to inspect in high-resolution
At this point, you might have an idea about why I withheld this information for five years. But just in case the gradual changes of time are not entirely apparent, here are some statistical realities.

Click on image to inspect in high-resolution
To further illustrate the differences between these time periods here are a few "banners" as a snapshot comparison of three years in history — it's first, twentieth, and how it will be for its fiftieth (assuming, nothing else is taken away during that time)

Click on image to inspect in high-resolution
Finally, and in order to simplify the changes, here is a visualization of the many attractions that have come and gone in the park's half-century existence.

Click on image to inspect in high-resolution
PART II
The Price of Magic
Although the most interesting and complex, the Supply of enjoyment in the park isn’t the only variable to take into account when examining the Economic value of the park. For that you also need, to know how much it costs and, in the case of theme parks, that’s a function of the ticket price.
As Rumpelstiltskin, famously said repeatedly on the TV series Once Upon a Time: “All magic comes with a price”. It should come as no shock that prices have risen over half a century but what should be concerning is the exponential rate at which ticket prices have exploded in the last decade. But to be completely fair, nominal ticket price (in Yellow) has been paired with “Real” or Inflation Adjusted values (In Red) for historical context as well as the standard rate of US Dollar inflation (in Green). In this case, this was calculated on the Median ticket price of $39. However, do not pay attention to where it is on the Y-axis as it could easily slide up and down. The important thing to consider with the US rate if Inflation is the (gradual) curvature in comparison to the other data sets.

Click on image to inspect in high-resolution
Concerning Ticketbooks
First, a bit of brief history. Before Disneyland opened in 1955, all rides charged individual admission to be paid and the entrance of each experience and it was free to enter the park. Among its many firsts, Disneyland was the first to charge a General (or Gate) Admission for many reasons, not the least of which was to maintain a family atmosphere. Additionally, the park used a ticket system (rather than cash) to experience their attractions with a letter rating attached to each. A-Tickets were designated for simple attractions like Main Street’s Omnibus or Cinderella’s Golden Carousel moving all the way up to E-Ticket attractions like The Haunted Mansion or Space Mountain.
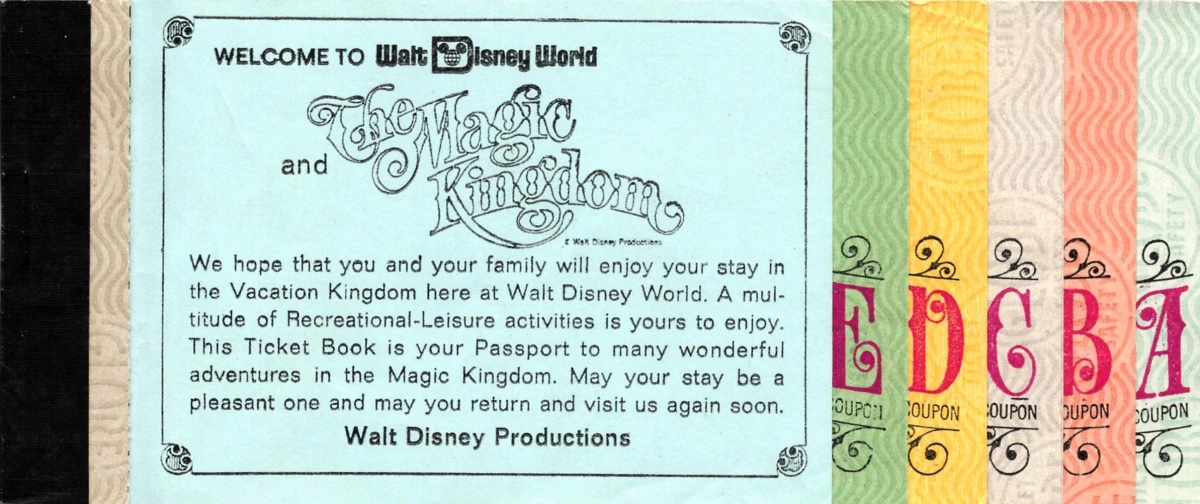
This system was used at The Magic Kingdom as well for its first ten years and then retired in 1981 for an all-inclusive admission. During its use, the Ticket books came in a variety of combinations the largest of these being the "12 Adventure Book” which included General Admission to the park and 12 A-E Tickets.
In order to mirror the functionality of the Ticket Book System as closely as possible to the present-day admission, the overall price of those first ten years was computed by doubling the 12 Adventure Book price and subtracting the (duplicated) admission cost. As you can see, there was a very noticeable dip in price for that first year in 1981 as the new all-inclusive price was significantly under-valued.
Now, we can combine these two data sets of Supply and Cost, to come up with some unique discoveries that just might (wink, wink) explain a few things regarding changes in guest satisfaction.
By taking the adjusted (of inflation) Ticket Price and dividing the cumulative hours of attractions we can see (perhaps for the first time ever) the potential cost per hour of the Magic Kingdom throughout time.

Click on image to inspect in high-resolution
The reason why I emphasize “potential” cost, is that this infographic presents the best possible outcome assuming that the guest was able to experience all attractions available in the park that day. And (in the case of 2021 and onward) does not nor could not take into account the cost of both Genie+ and/or Lightning Lane priority entrance systems